The ABA Revenue Formula
Every ABA practice’s revenue boils down to a simple equation:
Revenue = Billable Hours × Reimbursement Rate × Staff Count
But the reality is more nuanced. You have different staff types (RBTs and BCBAs) billing at different rates, multiple payers with different reimbursement schedules, and leakage from denials and underutilization.
Let’s break it down.
Step 1: Understand Your Payer Mix
Your payer mix — the percentage of clients under each insurance type — has a massive impact on revenue. Typical ABA reimbursement rates vary widely:
| Payer Type | RBT Rate (per hour) | BCBA Rate (per hour) |
|---|---|---|
| Commercial Insurance | $55–75 | $85–120 |
| Medicaid | $35–55 | $60–90 |
| Private Pay | $75–100+ | $100–150+ |
A practice with 70% commercial clients will earn significantly more per billable hour than one that’s 70% Medicaid. Neither is inherently better — Medicaid often provides more consistent client volume — but you need to know your weighted average rate to forecast accurately.
Weighted Average Rate = Sum of (Payer % × Payer Rate) across all payers
Step 2: Calculate RBT Revenue
RBTs generate the bulk of revenue in most ABA practices through direct service hours.
Monthly RBT Revenue = Number of RBTs × Billable Hours per Week × Weighted Rate × 4.33 weeks/month
For example: 5 RBTs × 25 hours/week × $58/hour × 4.33 = $31,378/month
The key variable here is billable hours. Most RBTs work 30-40 hours per week, but only 20-30 of those hours are billable direct service. The rest goes to documentation, travel, training, and breaks.
Step 3: Calculate BCBA Revenue
BCBAs bill for supervision, assessments, and treatment planning at higher rates but typically fewer hours.
Monthly BCBA Revenue = Number of BCBAs × Billable Hours per Week × Supervision Rate × 4.33 weeks/month
For example: 2 BCBAs × 15 hours/week × $100/hour × 4.33 = $12,990/month
Step 4: Factor In Revenue Leaks
Claim Denials
The average ABA practice sees 5-15% of claims denied. At $44,000/month in gross revenue, an 8% denial rate costs you $3,520/month or $42,240/year.
Common denial reasons:
- Expired or missing authorizations
- Incorrect CPT codes
- Incomplete documentation
- Duplicate claims
- Timely filing violations
Underutilization
If your clients are authorized for 20 hours/week but you’re only scheduling 15, you’re leaving 25% of potential revenue undelivered. For a 20-client practice at $58/hour, that gap costs:
20 clients × 5 lost hours × $58 × 4.33 = $25,114/month
This is often the single largest revenue leak in ABA practices.
Step 5: Your Net Revenue
Net Monthly Revenue = (RBT Revenue + BCBA Revenue) − Denial Costs
Net Annual Revenue = Net Monthly × 12
Use Our Free Calculator
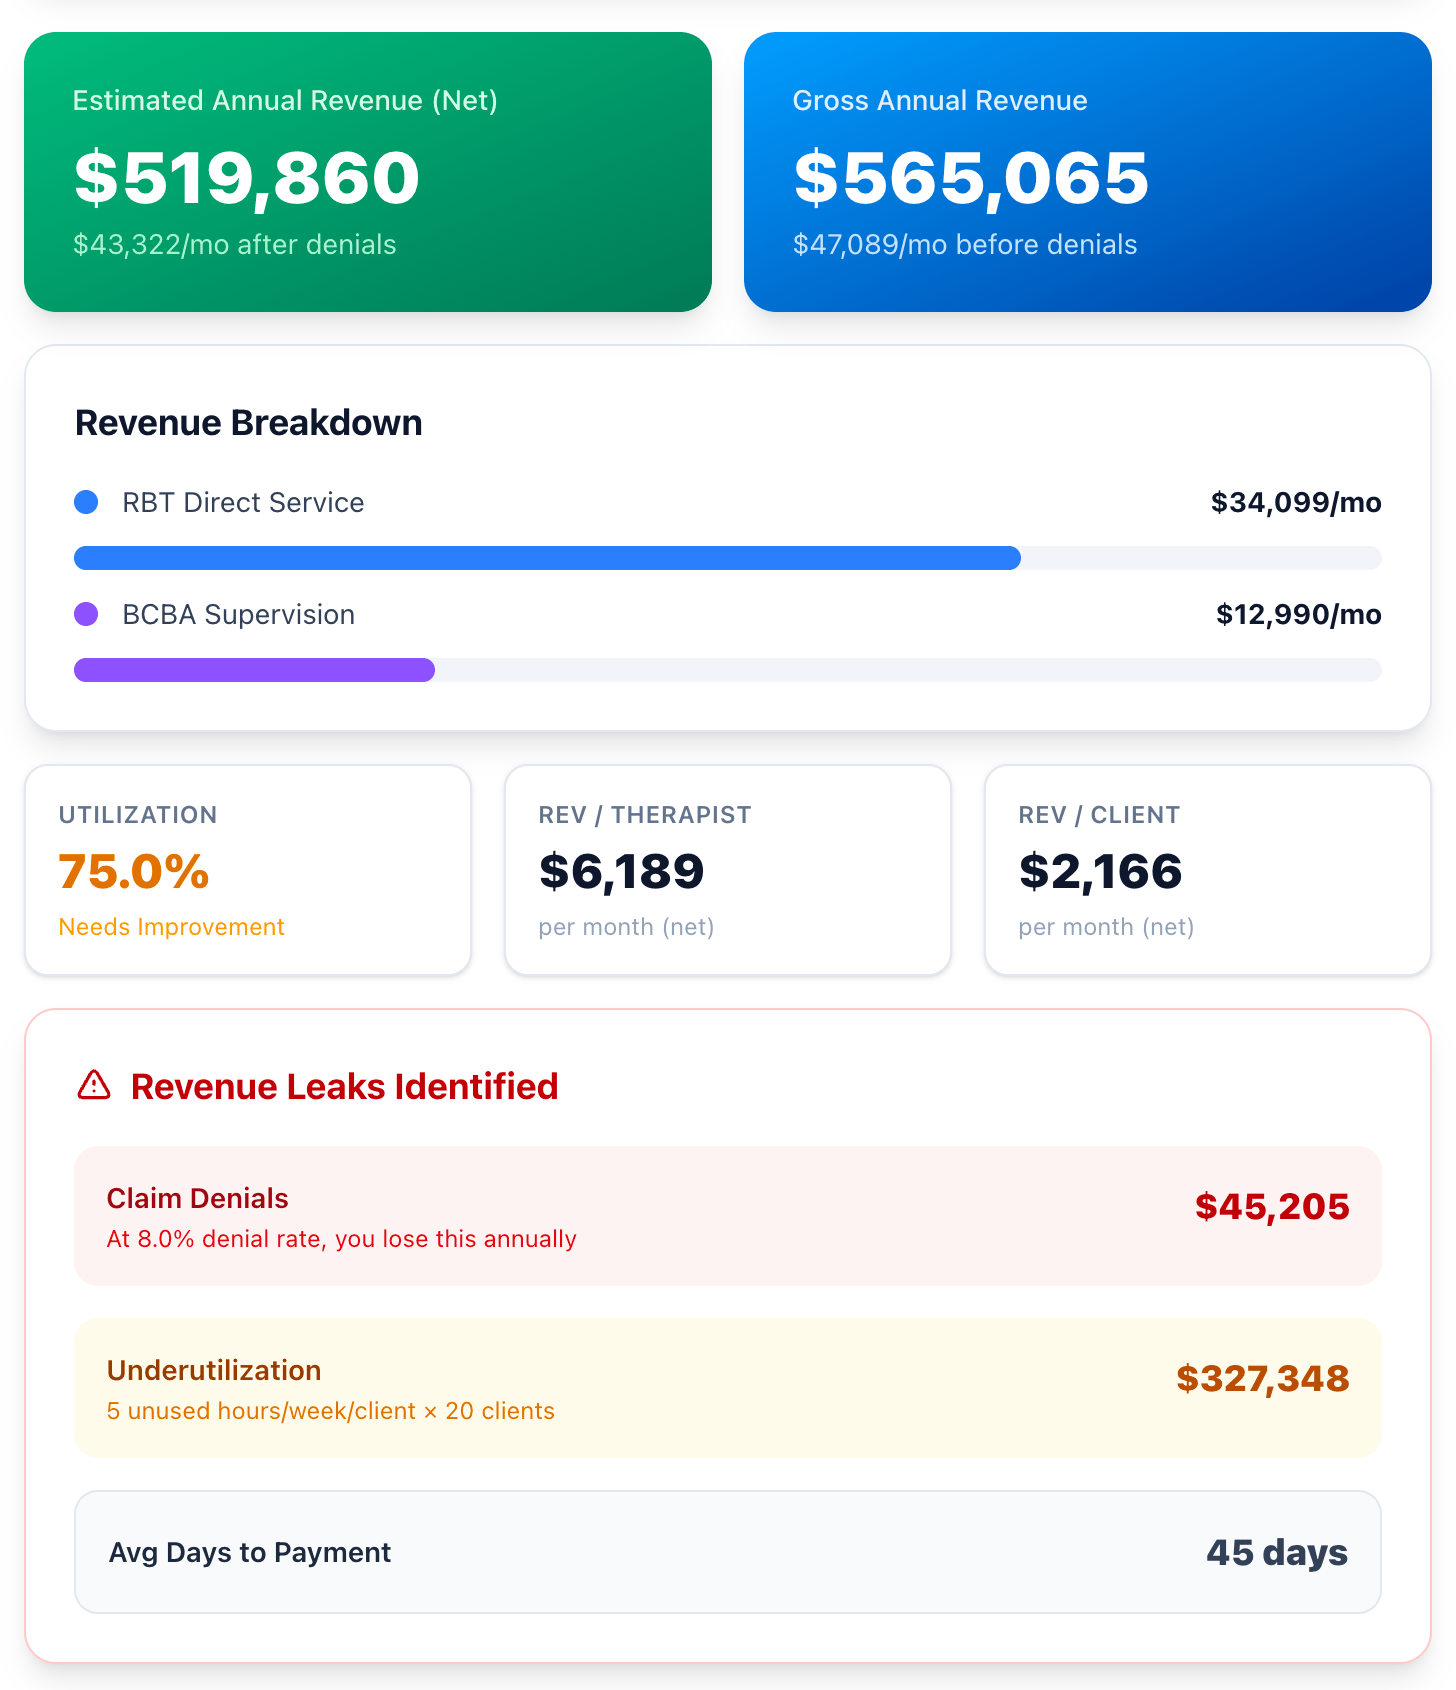
Instead of doing all this math by hand, we built an interactive calculator that walks you through each step and shows you:
- Projected monthly and annual revenue
- Revenue split between RBT and BCBA services
- Utilization rate with status indicators
- Annual cost of claim denials
- Annual cost of underutilization
- Revenue per therapist and per client
Use the free ABA Revenue Calculator →
All calculations happen in your browser — we don’t store any of your data.
Key Benchmarks to Watch
| Metric | Target | Warning |
|---|---|---|
| Utilization Rate | 85%+ | Below 70% |
| Denial Rate | Under 5% | Above 10% |
| Days to Payment | Under 30 | Above 60 |
| Revenue per RBT | $6,000+/mo | Below $4,500/mo |
How StreamABA Helps
StreamABA gives you real-time visibility into all of these metrics:
- Utilization dashboards that flag underutilized authorizations before they expire
- Automated claim scrubbing that catches errors before submission
- Revenue analytics broken down by payer, provider, and service type
- Staff utilization reports that show billable hours per therapist
Stop guessing about your practice’s financial health. Learn more about StreamABA →